Every battery loses a little charge just sitting on a shelf, untouched, doing nothing. Engineers have a name for this quiet drain: self-discharge. In most consumer gadgets, it barely registers — you charge your phone a bit more often, no big deal. But in grid storage systems, electric vehicles, and anything classified as safety-critical, that slow leak can mean the difference between a cell that’s simply aging normally and one that’s hiding a defect nobody’s caught yet.
At Sinexcel-re, low self-discharge testing isn’t a box to check at the end of production — it’s built into how quality gets verified from the start. This article walks through why cells bleed charge in the first place, how labs actually measure that loss, and what the resulting numbers are trying to tell you.
What Is Low Self-Discharge?
Self-discharge describes the energy a battery loses when it’s sitting idle, disconnected from any load. Nothing is drawing current through a circuit. Instead, the loss happens internally, through chemical reactions and physical processes that never really stop, even when the battery isn’t “doing” anything.
A cell with low self-discharge can sit in storage for months and barely lose a percentage point. One with poor self-discharge characteristics might shed several points of capacity in a single day, which sounds small until you multiply it across a whole fleet of batteries waiting in a warehouse.
Picture a backup power system that only gets used a handful of times a year. If those batteries can’t hold their charge between uses, they’ll fail exactly when they’re needed most — during an outage. Low self-discharge cells are what keep that system dependable rather than a liability.
What Causes Battery Self-Discharge?
There is no single cause. Several mechanisms act at the same time, and they don’t all share the same origin — which is exactly what makes diagnosis difficult.
- Electrolyte decomposition. This is a slow chemical process that is accelerated by heat and gradually depletes the stored charge.
- Parasitic side reactions at the electrodes. Chemical reactions occurring on the electrode surface consume electrons, thereby reducing the battery’s ability to store charge. For example, in lithium-ion batteries, a layer of SEI film continuously forms on the cathode, consuming lithium ions.
- Internal micro-shorts. These are microscopic conductive pathways formed on the separator, causing charge to leak out of the battery. This process is entirely distinct from chemical self-discharge because it does not occur continuously; it may develop over time and is typically caused by defects present during the manufacturing process rather than by chemical reactions.
- Manufacturing contamination. Metal debris or other impurities may enter the separator, forming unintended connections.
- Temperature. Nearly all of these processes speed up with heat. A cell stored at 40°C self-discharges noticeably faster than the same cell at 20°C, so storage conditions can matter as much as the cell’s intrinsic design.
Telling ordinary chemical loss apart from defect-driven loss is, in essence, the whole reason systematic self-discharge testing exists.
Battery Self-Discharge Testing Methods
No single method covers every scenario. Labs typically lean on a combination of approaches, chosen based on what they’re actually trying to find out.
Open Circuit Voltage (OCV) monitoring tracks how voltage drifts downward over time on a fully charged cell that’s been disconnected. It’s straightforward and doesn’t damage the cell, though it can take weeks before the signal becomes reliable enough to act on.
Coulombic efficiency testing looks at the ratio of charge going in versus charge coming back out across repeated cycles. A cell with weak coulombic efficiency is losing charge internally, even in cases where its voltage appears perfectly stable on the surface.
Capacity retention testing takes a more direct route: charge the cell, store it for a defined period, then discharge it fully to see exactly how much capacity remains. This produces a concrete, usable percentage loss figure rather than an inference.
Accelerated storage testing pushes temperature higher to speed up the underlying self-discharge mechanisms, then extrapolates the results back to what would happen at room temperature. It saves time, but it only works if the extrapolation model is sound.
High-precision coulometry (HPC) goes a step further, catching charge imbalances so small that voltage-only measurements would miss them entirely.
Most serious quality programs don’t rely on just one of these — they layer two or three together, because each method has blind spots the others can cover.
| Method | What It Measures | Main Consideration |
|---|---|---|
| OCV monitoring | Voltage change during storage | Voltage drift does not directly equal capacity loss |
| Capacity retention testing | Change in measurable discharge capacity | Requires consistent pre-storage and post-storage procedures |
| Coulombic efficiency | Charge recovered relative to charge supplied during cycling | Not equivalent to a standalone static self-discharge test |
| High-precision coulometry | Small charge imbalances and related electrochemical behavior | Requires suitable measurement precision and test protocols |
| Elevated-temperature storage | Behavior under controlled elevated-temperature conditions | Extrapolation requires validation |
Low Self-Discharge Test Procedure
A well-run low self-discharge test tends to follow a fairly consistent sequence, even if the specific durations shift depending on the application:
- Formation and stabilization— cycle the cell a few times so it settles into a stable, repeatable baseline state.
- Full charge— bring the cell to 100% state of charge, keeping current and voltage tightly controlled throughout.
- Rest period— let the cell sit for an hour or longer, giving the voltage time to settle before anyone records a baseline reading.
- Initial measurement— log the starting voltage, and starting capacity where that’s measurable.
- Storage period— hold the cell at a controlled temperature for a defined window, commonly 7, 14, or 30 days.
- Final measurement— record the ending voltage, or discharge the cell fully to measure what capacity remains.
- Calculation— compare the initial and final readings and derive the self-discharge rate.
Temperature control matters at every single stage of this. A test chamber drifting even a couple of degrees off target can quietly distort the final numbers enough to change the conclusion.
How to Analyze Self-Discharge Test Results?
Numbers on their own — a voltage reading here, a capacity figure there — don’t tell you much. The real work is in the analysis.
Start by converting the raw data into a self-discharge rate expressed as a percentage per unit of time, then compare it against what’s expected for that chemistry. A lithium iron phosphate cell that loses 5% in a week, when 1% is the norm, is telling you something worth investigating further.
It also helps to look at the shape of the voltage curve rather than fixating only on the start and end points. A gradual, linear decline usually points to ordinary chemical self-discharge doing what it does. A sharp early drop that then flattens into a plateau can suggest something else entirely — sometimes a micro-short that’s partially self-healed, which is its own kind of red flag.
Comparing results across an entire batch, rather than examining cells in isolation, tends to surface what actually matters. Outliers deserve more attention than averages do. If one cell in a batch is losing charge at twice the rate of its neighbors, that’s worth a closer look, even when the batch-wide average looks perfectly healthy.
Cross-referencing with impedance data, when it’s available, adds another layer of confidence. Rising internal resistance paired with elevated self-discharge is a fairly strong indicator of a genuine defect, rather than noise in the measurement.
Factors That Affect Self-Discharge Test Results
A number of variables can quietly skew results if they aren’t tightly controlled:
- State of charge at the start of testing.Cells tested at 100% SOC don’t behave identically to cells tested at 50%.
- Storage temperature.Even minor fluctuations shift reaction rates in ways that show up in the data.
- Cell age and cycling history.A battery that’s been through hundreds of cycles won’t behave like a fresh one off the line.
- Precision of the measurement equipment.Low-resolution voltage meters simply can’t catch subtle drift.
- Contact resistance.Poor electrical connections during measurement introduce readings that don’t reflect the cell’s real behavior.
- Ambient humidity.Over long storage windows, high humidity can compromise seal integrity in ways that affect the outcome.
Labs that get consistent, trustworthy results tend to isolate these variables one at a time rather than letting several shift at once. That discipline is really what separates a repeatable testing program from something closer to guesswork.
Low Self-Discharge vs. Voltage Relaxation
People mix these two up constantly, but they describe entirely different phases of a cell’s behavior.
Voltage relaxation kicks in right after charging or discharging ends. The cell’s internal chemistry hasn’t settled into equilibrium yet, so the voltage drifts — sometimes for minutes, sometimes for hours — before it stabilizes. This isn’t charge loss at all. It’s simply the cell finding its resting point.
Self-discharge, on the other hand, begins once that relaxation period has already wrapped up. It represents genuine, ongoing loss of stored energy that plays out over days or weeks.
Getting this distinction wrong skews results badly. Measure voltage too soon after charging, and what you’re actually capturing is relaxation, not self-discharge — the reading will look far worse than reality warrants. That’s precisely why any properly designed self-discharge procedure builds in a rest period before the baseline reading gets taken.
How Long Does Self-Discharge Testing Take?
Standard self-discharge tests generally run somewhere between one and four weeks. For applications where reliability really can’t be compromised — grid storage, aerospace — some quality programs stretch that window out to 90 days or more.
Accelerated testing at elevated temperatures compresses the timeline considerably. A test that would ordinarily take a month at room temperature might wrap up in about a week at 45-60°C, relying on extrapolation models to translate those results back into room-temperature terms.
There’s a trade-off either way. Shorter tests sacrifice some accuracy for speed; longer tests catch slow-developing defects that a quick screen would sail right past. Most manufacturers split the difference — a fast screening pass on every single cell, plus a longer, confirmatory test run on samples pulled from the batch.
How to Improve Self-Discharge Test Efficiency?
Testing thousands of cells one at a time simply isn’t realistic once you’re operating at production scale. A few strategies help labs keep pace without cutting corners on rigor.
Parallel testing setups let hundreds of cells get monitored simultaneously through multi-channel battery testing equipment, cutting total test time dramatically compared to running cells one after another.
Statistical sampling tests a representative slice of each production batch instead of every single unit, while keeping full testing in reserve for any cells that throw up early warning signs.
The data is automatically recorded, eliminating the manual error that can happen during long test runs, and analysis time is significantly cut, as the software is able to identify outliers, rather than having to sift through spreadsheets manually.
Running both accelerated and standard protocols together allows teams to get immediate preliminary results and a smaller sample to run the full-length test and validate the results.
Predictive modeling uses past data to help predict future self-discharge characteristics from early measurements, thus reducing the amount of time the cells are required to be stored before a decision is made.
Battery Testing Equipment for Low Self-Discharge Testing
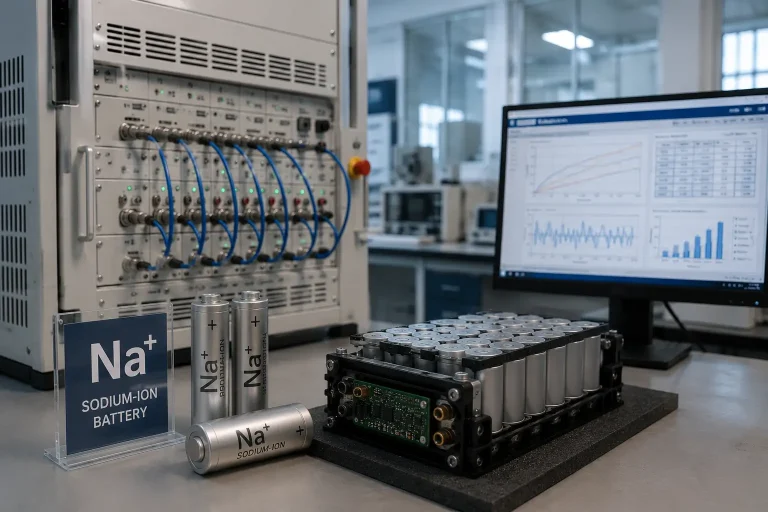
None of this works without the right hardware behind it. The core equipment typically includes:
- High-precision battery cyclersthat charge and discharge cells under tightly controlled current and voltage.
- Environmental test chamberscapable of holding temperature steady within fractions of a degree.
- High-resolution data acquisition systemsthat can detect millivolt-level voltage shifts over extended periods.
- Coulometry systems,which measure charge with extreme precision — often down to parts-per-million accuracy.
- Impedance analyzers,adding a second layer of data beyond voltage and capacity alone.
Sinexcel-re builds its testing solutions specifically around this need: equipment sensitive enough to catch the subtle signals that separate a genuinely healthy cell from one carrying a hidden defect.
Low Self-Discharge and Soft Internal Short Screening
Soft internal shorts rank among the hardest defects to catch. They don’t cause outright, immediate failure. Instead, they create a small, partial short circuit that bleeds charge away slowly — and sometimes only intermittently, which makes them even harder to pin down.
Low self-discharge testing happens to be one of the more effective tools for catching these defects before a cell ever ships. A cell carrying a soft internal short shows abnormal voltage decay that a standard capacity test can easily miss. Left unchecked, that same defect can progress into thermal runaway over time, particularly in lithium-ion chemistries where the stakes are highest.
Screening programs generally flag any cell whose self-discharge rate falls outside a tight statistical band relative to its peers. Flagged cells get pulled for closer inspection — often X-ray imaging, sometimes full disassembly analysis.
This step protects both physical safety and brand reputation at once. A battery that fails in the field because of an undetected soft short ends up costing far more than the time it would have taken to catch it during testing.
Conclusion
Low self-discharge testing does more than confirm a number on a spec sheet. Done well, it catches defects other tests routinely miss, protects safety in applications where failure isn’t an option, and builds the kind of long-term trust that keeps a product line credible.
None of it is fast or effortless — it demands patience, tightly controlled conditions, and equipment built for the job. But the payoff shows up later: batteries that still perform after months in storage, and manufacturers who catch problems before they turn into recalls.
Sinexcel-re designs its testing programs and equipment around exactly this outcome, helping teams turn raw self-discharge data into products they can stand behind with confidence.
FAQ
What counts as a good self-discharge rate for lithium-ion batteries?
Healthy lithium-ion cells generally lose 1-2% of capacity per month at room temperature. Anything meaningfully higher deserves a closer look.
Can self-discharge be reversed?
Not really — once charge is lost to self-discharge, it’s gone for good. The only way to restore capacity is to recharge the cell.
Does self-discharge testing damage the battery?
Standard testing at normal conditions doesn’t harm cells. Accelerated testing at higher temperatures can age a cell slightly faster than typical use, which is something labs factor into their models rather than ignore.
How does self-discharge differ from normal battery aging?
Aging refers to permanent capacity loss that accumulates over a battery’s lifetime through repeated cycling. Self-discharge, by contrast, is temporary loss that occurs during storage and has nothing to do with cycle count.
Why do temperature-controlled chambers matter so much for this kind of testing?
Because self-discharge reactions are highly sensitive to temperature. Even a small swing during a multi-week test can introduce enough noise to mask a real defect — or, just as easily, manufacture one that isn’t actually there.