导言
In the rapidly changing world of energy storage, accurately characterizing and monitoring battery performance becomes increasingly important. At SINEXCEL-RE, where our mission is to provide precise, reliable, and efficient battery testing solutions, one of the most powerful tools in our armory is Electrochemical Impedance Spectroscopy (EIS).
Principles and Key Concepts
Electrochemical Impedance Spectroscopy (EIS), or AC impedance spectroscopy, is a non-destructive electrical measurement technique to probe the internal electrochemical behavior of devices like batteries. In general, EIS applies a small AC or voltage signal over a cell and sweeps that signal over a wide range of frequencies while measuring how the system responds. Analyzing the response in terms of impedance, EIS will provide information on internal resistances, capacitances, charge‐transfer processes, and diffusion effects.
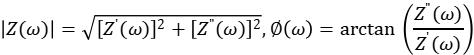
Mathematically, impedance is defined as:
![]()
Where:
- is the small AC voltage applied (complex amplitude)
- is the current response (complex)
- is the real part (resistive)
- is the imaginary part (reactive)
From these, you can also compute the magnitude 和 phase:
These frequency-dependent values get plotted in two common ways:
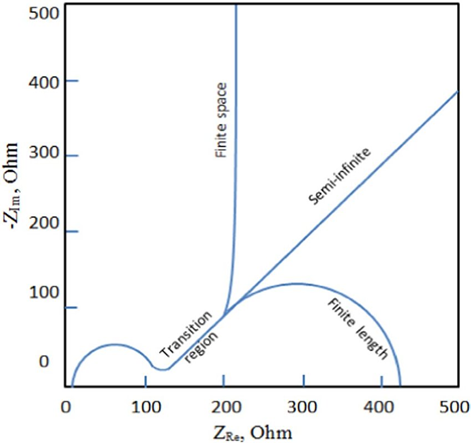
- Nyquist plot: plots (imaginary) vs. (real)
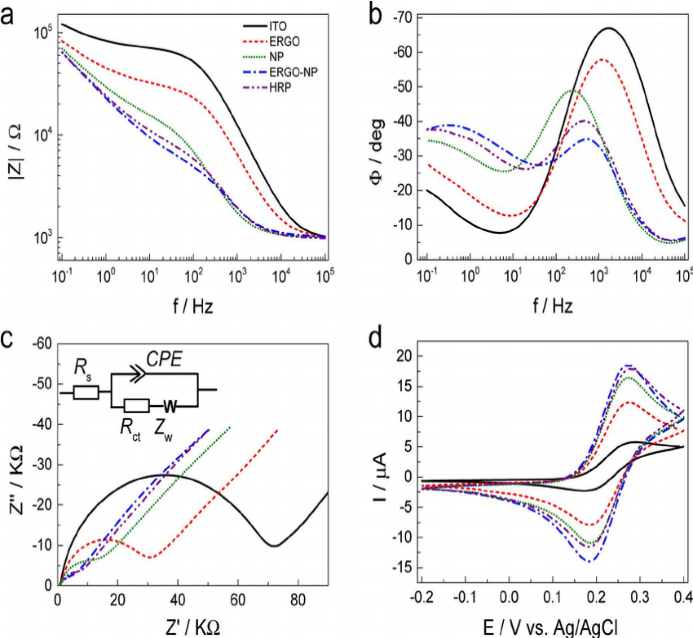
- Bode plot: plots and phase frequency
 |  |
a. Nyquist Plot | c. Bode Plot |
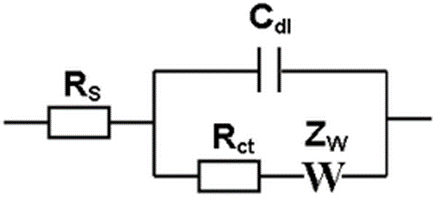 | |
c. Equivalent Circuit | |
Figure 1: Schematic of Typical EIS Response
The Figure 1 above illustrates three fundamental visuals used in Electrochemical Impedance Spectroscopy (EIS). The Nyquist plot shows the real impedance on the x-axis and the negative imaginary component on the y-axis, typically featuring a semicircle that represents charge-transfer resistance followed by a 45° Warburg tail indicating ion diffusion. the Bode plot shows how the magnitude and phase angle of impedance change over frequencies, thus reflecting transitions between resistive, capacitive, and diffusion-controlled behaviors. Finally, the equivalent circuit diagram-the Randles circuit being a common one-models these electrochemical processes in terms of ohmic resistance, double-layer capacitance, charge-transfer resistance, and Warburg diffusion impedance. Collectively, these three visuals provide a complete interpretation framework in understanding battery internal dynamics through EIS.
Why Is EIS So Valuable for Battery Testing?
For a company like SINEXCEL-RE, dealing exclusively in high-precision battery test systems, EIS is a necessity rather than an option. It is non-destructive; hence, several measurements can be made during cycling and aging studies, or even on items subjected to quality-control testing, without affecting the performance of the battery. EIS also provides profound insight into internal processes, with high frequencies probing ohmic resistance and mid-to-low frequencies disclosing charge transfer and diffusion-limited behavior, such as the Warburg impedance associated with ion diffusion. Besides this, it provides for appropriate health and state estimation by offering signatures that correlate with State of Charge (SoC), State of Health (SoH), and degradation trends, further enhancing the advanced BMS functionality. Finally, EIS is flexible and scalable, fitting seamlessly into workflows for single cells, modules, or full packs, thus making it perfectly suitable for both R&D and mass-production quality control.
How EIS Works: Key Steps & Considerations
Here’s a simplified flow of how EIS is carried out in a battery test system:
| Step | 说明 | Notes / Key Points |
| 1. Cell Setup | Connect the battery/cell to a test system (e.g., potentiostat or battery test system) in a controlled environment. | Ensures stable and reproducible conditions. |
| 2. Applying the Perturbation | Superimpose a small sinusoidal AC signal (a few mV or small fraction of cell voltage) over a DC bias if required. | AC signal should be small enough to remain in the linear response region. |
| 3. Sweeping Frequencies | Sweep the signal over a wide frequency range (kHz to mHz) to capture all relevant electrochemical dynamics. | High frequencies probe charge transfer; low frequencies probe diffusion and mass transport. |
| 4. Measuring Response | Measure current response (if voltage-controlled) or voltage response (if current-controlled) at each frequency; record amplitude and phase lag/lead. | Accurate measurement of phase and magnitude is crucial for impedance calculation. |
| 5. Analyzing Impedance | Calculate complex impedance from the recorded data, plot Nyquist and Bode plots, and fit to an equivalent circuit model (ECM). | Extracts meaningful parameters like resistances, capacitances, and diffusion coefficients. |
| 6. Interpreting Results | Use extracted parameters to assess battery health and performance. | Examples: Increased resistance → aging; changes in diffusion → electrode/material degradation. |
Challenges & Best Practices
While EIS is extremely powerful, real-world measurement comes with challenges:
| Challenge / Consideration | 说明 | Best Practices / Notes |
| Time | Low-frequency EIS measurements can be slow, sometimes taking 10+ minutes per sweep. | Use optimized frequency ranges, multi-sine or fast sweep techniques to reduce measurement duration. |
| Noise & Accuracy | Small impedance changes, especially in low-impedance cells, require high sensitivity. | Ensure proper shielding, low-noise instrumentation, and stable environmental conditions. |
| Model Ambiguity | Selecting the appropriate equivalent circuit model is non-trivial; wrong choice leads to misleading results. | Combine prior knowledge of cell chemistry with model fitting; validate models against experimental data. |
| Online Implementation | Integrating EIS into real-time BMS is challenging due to long measurement times. | Use fast algorithms (FFT, multi-sine excitation) and adaptive sampling to enable practical online monitoring. |
The Future with EIS & Smart Battery Systems
Looking ahead, EIS is becoming a key enabler for smart, adaptive battery management. Trends to watch will include:
- Inline and Real-Time EIS: Integration of EIS into battery management systems to execute periodic impedance measurements without the interruption of operation can help in predicting aging, faults, or even avoiding failures.
- Fast EIS Techniques: Using non-sinusoidal signals-such as square-wave excitation-or multisine excitation, coupled with signal processing such as FFT or Laplace transforms to drastically reduce the measurement time.
- Machine Learning + EIS: Application of data-driven models to EIS spectra for the estimation of State of Health or Remaining Useful Life of batteries.
结论
EIS is much more than a diagnostic technique; rather, it’s a window into the soul of a battery. For SINEXCEL-RE, leveraging EIS means delivering world-class battery testing and energy storage solutions that are accurate, reliable, and insightful. Through EIS paired with the proven test systems and data analytics capabilities we offer, we give our customers – from battery manufacturers to grid-scale storage operators – the ability to understand, monitor, and ultimately optimize their energy storage assets better than ever before.
For those interested in how SINEXCEL-RE may interface EIS into your existing testing (or storage) infrastructure, please reach out to us to discuss customized capabilities.
常见问题
- What is EIS?
Answer: EIS measures how an electrochemical system (like a battery or fuel cell) resists and reacts to a small AC signal over different frequencies.
- How does it work?
Answer: A small AC voltage is applied, the resulting current is measured, and the impedance is calculated across frequencies.
- What can EIS tell us?
Answer: It reveals charge transfer resistance, capacitance, ion diffusion, corrosion rates, and battery or fuel cell health.
- Why use EIS?
Answer: It is non-destructive, separates processes at different time scales, and gives detailed insights into electrochemical reactions.