The battery testing has progressed far beyond the basic charge discharge cycles and voltage testing. Today, Electrochemical Impedance Spectroscopy (EIS) is a much more accurate technique used by engineers and researchers. For battery developers, energy storage companies, and electric vehicle manufacturers, it’s no longer a choice but a necessity to understand EIS. It is one of the most reliable methods for looking into a battery without opening it up.
This guide explores what EIS is, how it works, when it might be used, and what steps will result in reliable outcomes.
What Is Electrochemical Impedance Spectroscopy?
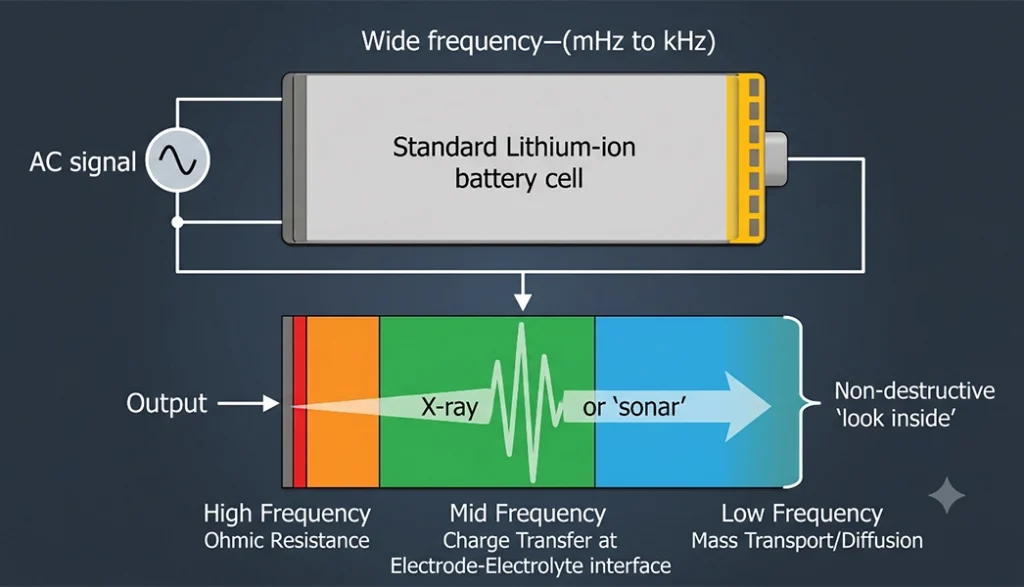
The principle of EIS is to measure the response of a battery to alternating current with various frequencies. A small AC voltage is passed through the battery at many frequencies (usually from several millihertz to several hundred kilohertz) and the response is measured. What is obtained is a frequency dependent impedance spectrum with much information about the electrochemical processes within the battery.
What makes EIS uniquely powerful is that different internal components of a battery respond differently at different frequencies. The high-frequency region captures ohmic resistance — basically the resistance of the electrolyte, current collectors, and cell connections. The mid-frequency region reveals charge transfer resistance and double-layer capacitance at the electrode-electrolyte interface. The low-frequency region reflects mass transport processes, particularly diffusion of lithium ions through the electrode material.
This multi-layered view of the battery’s internal behavior is something no other single technique provides. Voltage curves tell you capacity. EIS tells you why the capacity is changing.
Static EIS vs. Dynamic EIS: Not the Same Thing
Traditional EIS — sometimes called static EIS — requires the battery to be fully equilibrated before the measurement begins. The cell must be at rest, thermally stable, and in a steady electrochemical state. This is important because classical EIS theory demands linearity, time-invariance, and stationarity. Violating these conditions introduces distortions into the spectrum that can lead to misinterpretation.
Dynamic EIS changes this equation. Instead of waiting for equilibrium, dynamic EIS is performed while the battery is actively charging or discharging — in other words, with a DC bias applied alongside the AC excitation signal. The advantage is obvious: you get impedance data that reflects real operating conditions rather than an idealized resting state.
But dynamic EIS comes with trade-offs that must be taken seriously. Because the battery’s state is continuously evolving during measurement, the system is inherently non-stationary. This means the impedance data are approximations. They can capture transient processes — like lithium plating, dendrite growth, or rapid charge-transfer dynamics — that would simply vanish during a rest period. Still, researchers must validate dynamic EIS results carefully before drawing conclusions from them. Comparing them against static EIS data at specific states of charge is considered good practice.
Reading the Nyquist Plot: What the Shape Tells You
EIS data is usually displayed as a Nyquist plot, where the real part of the impedance sits on the x-axis and the negative imaginary part on the y-axis. A healthy lithium-ion battery typically shows a compressed semicircle in the mid-frequency range followed by a sloped line at low frequencies.
The diameter of the semicircle corresponds to charge transfer resistance. When a battery ages, this semicircle typically grows. Electrolyte decomposition, SEI layer growth, and active material degradation all leave distinct marks on the spectrum. A seasoned analyst can often tell whether capacity fade is coming from the anode, the cathode, or the electrolyte simply by studying how the Nyquist plot has changed over several measurement cycles.
The low-frequency tail — often called the Warburg impedance — reflects ion diffusion. When it steepens significantly or takes on unusual shapes, it often points to blocked diffusion pathways or severe capacity limitation at depth of discharge.
Setting Up a Practical EIS Measurement: Key Parameters
Getting clean, interpretable EIS data is not just about having the right equipment. Protocol design matters enormously. Several parameters deserve careful thought:
- AC amplitude:This is arguably the most critical setting. Too large an amplitude violates the linearity assumption; too small produces a poor signal-to-noise ratio. A common starting point for lithium-ion cells is 5 to 10 mV. Using adaptive amplitude modes — where the instrument adjusts excitation based on real-time response — is increasingly popular as a way to simplify this choice.
- Frequency range:The range should match the processes of interest. If you are primarily looking at electrolyte resistance and charge transfer, the range 10 Hz to 100 kHz is often sufficient. For diffusion phenomena, you need to go down to 10 mHz or lower, which adds significant measurement time.
- Temperature control:Impedance is temperature-sensitive. A drift of even a few degrees Celsius during measurement can introduce artifacts. Stabilizing the test environment and allowing thermal equilibration before static EIS measurements are non-negotiable steps.
- Cable length and connections:Long cables introduce parasitic inductance and resistance that distort high-frequency data. Using short, well-shielded cables with proper four-wire (Kelvin) connections significantly improves data quality.
- Safety limits:Voltage cutoffs and temperature limits must be programmed into the test protocol. During dynamic EIS especially, conditions can evolve faster than expected, and safety guardrails protect both the cell and the instrument.
Equivalent Circuit Modeling: Turning Data Into Insight
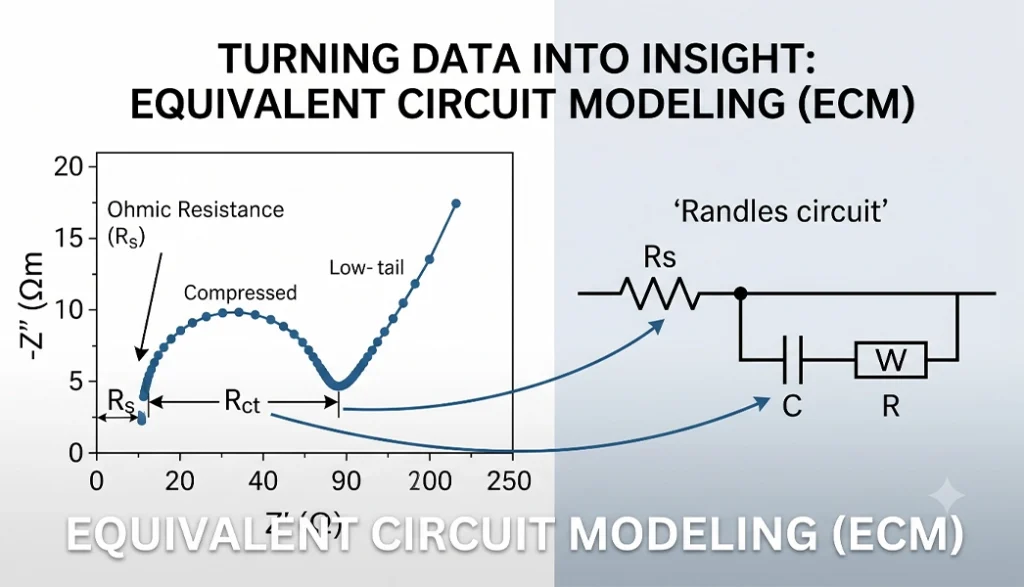
Raw impedance spectra become truly useful when fitted to an equivalent circuit model (ECM). An ECM is a combination of resistors, capacitors, and specialized elements like Warburg diffusion impedances — assembled in a configuration that mimics the electrochemical behavior of the real cell.
For a standard lithium-ion battery, the Randles circuit is a common starting model. It includes a series resistance representing the ohmic component, a parallel combination of charge transfer resistance and double-layer capacitance, and a Warburg element for diffusion. More complex cells — those with multiple electrode interfaces, coatings, or unusual chemistries — often require more elaborate circuit topologies.
Fitting software applies numerical optimization to extract the best-matching circuit parameter values from the measured spectrum. These parameters — ohmic resistance, charge transfer resistance, diffusion coefficient — can then be tracked over time, over charge cycles, or across operating temperatures to build a detailed picture of how the battery is degrading.
One important caution: equivalent circuit modeling involves some degree of ambiguity. Different circuit topologies can sometimes produce equally good fits to the same spectrum. Physical plausibility of the model — grounded in the actual chemistry and geometry of the cell — should always guide model selection.
Applications Across Battery Types and Industries
EIS is not limited to lithium-ion chemistry. It is equally applicable to lithium iron phosphate (LFP) cells, lithium polymer batteries, solid-state batteries, lead-acid, nickel-metal hydride, and emerging chemistries like sodium-ion. The fundamental principle of probing frequency-dependent impedance works across all electrochemical systems — each simply has its own characteristic spectral fingerprint.
In the electric vehicle industry, EIS has become an important tool for both cell-level R&D and pack-level health monitoring. Battery management systems (BMS) are increasingly being designed to incorporate on-board EIS capability, enabling real-time state-of-health estimation during vehicle operation.
In grid-scale energy storage, EIS helps operators understand whether a battery pack is degrading uniformly or showing localized failures — information that matters a great deal for maintenance planning and system reliability.
At the manufacturing level, EIS is used for formation monitoring and grading. Subtle differences in impedance spectra between freshly formed cells can identify quality outliers before they enter the supply chain — a far more sensitive screen than capacity testing alone.
EIS in Real-World Battery Testing Systems
High-precision test systems are required to implement EIS at scale in EV and energy storage applications. Industrial battery testing platforms typically require high accuracy, fast response, and stable measurement capability.
Precision measurement is only as good as the equipment it runs on. Sinexcel-RE, a wholly-owned subsidiary of Sinexcel established in 2007, has built its reputation on exactly this point. The company specializes in high-precision battery testing systems for the energy storage and electric vehicle markets — serving customers across more than 60 countries from its headquarters in Shenzhen, with manufacturing facilities in Huizhou and Suzhou.
What is particularly relevant to EIS-based testing is Sinexcel-RE’s emphasis on measurement accuracy. Their systems specify voltage and current accuracy down to 0.02% of full scale — a level of precision that matters when you are trying to resolve small impedance changes indicative of early-stage degradation.
Their product lineup spans milliampere-level component testing all the way to high-voltage battery cluster evaluation at up to 1700V — covering individual cells and modules (60V to 300V) as well as full packs (500V to 1000V). This breadth means that research labs characterizing individual cells and manufacturing plants running full pack validation can work within the same equipment ecosystem.
Sinexcel-RE also addresses one of the practical pain points in large-scale battery testing: energy efficiency. Their distributed dual-bus energy circulation architecture recovers energy from test cycles rather than dissipating it as heat — reducing operating costs and environmental impact simultaneously. For facilities running thousands of channels continuously, this is not a minor consideration.
The company’s Intelligent Laboratory Information Management System (LIMS) also plays a role in the data management aspect of EIS testing, serving to manage the ever growing amount of spectral data collected from numerous cells without requiring the right infrastructure.
Conclusion
Electrochemical impedance spectroscopy has moved from a laboratory curiosity to an industrial standard. Its ability to non-destructively probe battery internals — separating ohmic resistance from charge transfer from diffusion — makes it irreplaceable in any serious battery development or testing program.
Getting EIS right requires attention to protocol design, amplitude selection, temperature control, and data validation. The technique rewards care and penalizes shortcuts. But for those willing to do it properly, the diagnostic depth it provides is without parallel.
As battery technology continues to evolve — toward faster charging, higher energy density, longer life, and greater safety — EIS will remain one of the most important tools in the engineer’s kit. And as testing platforms like those from Sinexcel-RE continue to improve in precision, throughput, and energy efficiency, the barriers to deploying EIS at scale will keep falling.
FAQ
Q: How long does an EIS measurement take?
A: It depends on the frequency range. If you only need the mid-to-high frequency range (say, 1 Hz to 100 kHz), a measurement can complete in under a minute. If you need low-frequency data down to 10 mHz or lower, the measurement time grows substantially — sometimes to 30 minutes or more per spectrum. For dynamic EIS during cycling, the protocol is typically designed to take quick measurements at specific points in the charge-discharge cycle without significantly disrupting the overall cycle time.
Q: Can EIS detect lithium plating?
A: Yes, and this is one of the reasons dynamic EIS is attracting growing attention. Lithium plating — where metallic lithium deposits on the anode surface rather than intercalating into the graphite — is a serious safety and degradation concern during fast charging. It produces characteristic changes in the impedance spectrum, particularly in the mid-frequency region. Dynamic EIS, performed during the charging process, can capture these changes as they happen. Static EIS measured after a rest period may miss them entirely because the plated lithium can partially dissolve or redistribute.
Q: What is the difference between EIS and DC internal resistance measurement?
A: DC internal resistance — often measured by a simple current pulse — gives a single number that lumps together ohmic resistance, charge transfer resistance, and polarization effects. EIS separates these contributions by measuring across a range of frequencies. For a quick production-line check, DC resistance has its place. For understanding degradation mechanisms, diagnosing failure modes, or tracking state-of-health with precision, EIS provides information that DC resistance simply cannot.
Q: Is EIS destructive to the battery?
A: No. When performed correctly — with a small enough AC amplitude to keep the system in the linear regime — EIS is completely non-destructive. The excitation levels used in standard EIS measurements are far too small to cause any measurable capacity loss or structural change. This makes it suitable for long-term monitoring studies where the same cell is measured repeatedly over hundreds of cycles.
Q: How do you know if your EIS data is valid?
A: Several validation approaches exist. The Kramers-Kronig relations provide a mathematical test for self-consistency — a valid impedance spectrum must satisfy these relationships. Many EIS software packages include Kramers-Kronig validation as a built-in check. Additionally, total harmonic distortion (THD) is used to verify that the system is responding linearly to the excitation, and normalized standard deviation (NSD) checks for stationarity. Running these checks before proceeding to equivalent circuit fitting or interpretation is considered standard practice in serious EIS work.
Q: Can EIS be used on battery packs, not just individual cells?
A: Yes, though the interpretation becomes more complex. A pack contains many cells in series and parallel configurations, so the impedance spectrum reflects the combined behavior of all of them. Localized failures in individual cells become harder to resolve. That said, pack-level EIS is used in practice for overall state-of-health monitoring. High-voltage test systems — such as those offered by Sinexcel-RE for packs up to 1700V — are designed to handle the voltage ranges involved in large-format energy storage applications.